
Appearance
SRE & Incident Response
03SREIncident response
Context Graph tribal knowledge
service catalog · runbooks · prior incidents · oncall map
Sources
incident fires
Agentcy
Agentcy
SRE agent + runbook tools
diagnosis
Output
At a glance
The agent's job: receive a Grafana alert webhook, pull relevant Kubernetes pod / event data, check AWS resource state, cross-reference recent deploys, and page Slack #oncall with a one-paragraph hypothesis and a runbook link.
Stack
 Grafana — alert source via webhook, plus query tools for "what does the dashboard say right now?"
 Kubernetes — pod status, recent events, logs.
 AWS — EC2/RDS/CloudWatch state for the affected service.
 GitHub — recent merges to identify suspect deploys.
 Slack — outbound page to
 #oncall.- Webhooks & Triggers — Grafana alert webhook fires the task.
- Agent Loop — uses the catalog to find the right tool per question.
Slack only for proactive pages
Today the WhatsApp channel is reply-only — it answers messages people send, but cannot push outbound. Use Slack for incident pages. WhatsApp can still serve as a Q&A surface during an incident: oncall asks the bot questions and gets answers there.
What you'll build
- Grafana alert fires → webhook to Agentcy
/hooks/<id>(HMAC verified). incident-respondertask starts.- Agent parses alert labels (service, env, severity).
- Pulls K8s pod state + events + recent logs.
- Cross-references AWS resources mentioned in the alert.
- Looks for GitHub PRs merged to that service in the last 2 hours.
- Optionally renders a Grafana panel for context.
- Composes a one-paragraph hypothesis + runbook link.
- Posts to Slack
#oncallwith severity emoji and links.
Prerequisites
- Grafana configured as a connector (see Grafana docs). Required if you want the agent to query Grafana for context (recommended).
- Kubernetes configured. For multi-cluster, register one source per cluster.
- AWS configured if your stack uses managed services.
- Slack channel configured with a dedicated
#oncallchannel the bot can post to. - A frontier-class LLM. Diagnoses written by smaller models tend to be vague — exactly what oncall doesn't need at 3 AM.
- Workers (recommended) — incidents come in bursts.
AGENTCY_FEATURES_WORKERS=true.
Step-by-step
1. Configure the connectors
text
1. Open /connectors → click "+ Add Connector".
2. Pick Kubernetes → paste your kubeconfig (or pick "in-cluster
   service account" if Agentcy runs in K8s). Realm: infrastructure.
3. Repeat for AWS (assume-role recommended), GitHub (read-only is fine),
   and Grafana (service account token).
4. Hit "Test" on each — green pill = ready.bash
# Kubernetes
curl -X POST http://localhost:8080/api/v1/sources \
  -H "authorization: Bearer $TOKEN" -H 'content-type: application/json' \
  -d '{
    "name":"k8s-prod-us","connector":"kubernetes","realm":"infrastructure",
    "config":{"auth":{"kind":"kubeconfig","kubeconfig_data":"..."}}
  }'

# AWS
curl -X POST http://localhost:8080/api/v1/sources \
  -H "authorization: Bearer $TOKEN" -H 'content-type: application/json' \
  -d '{
    "name":"aws-prod","connector":"aws","realm":"infrastructure",
    "config":{"auth":{"kind":"assume_role","role_arn":"arn:aws:iam::1234:role/agentcy"},"regions":["us-east-1"]}
  }'

# GitHub (read-only)
curl -X POST http://localhost:8080/api/v1/sources \
  -H "authorization: Bearer $TOKEN" -H 'content-type: application/json' \
  -d '{
    "name":"github-services","connector":"github","realm":"development",
    "config":{"auth":{"kind":"pat","token":"ghp_..."},"orgs":["acme"]}
  }'

# Grafana (optional but recommended)
curl -X POST http://localhost:8080/api/v1/sources \
  -H "authorization: Bearer $TOKEN" -H 'content-type: application/json' \
  -d '{
    "name":"grafana-prod","connector":"grafana","realm":"infrastructure",
    "config":{"base_url":"https://grafana.internal","api_token":"glsa_..."}
}'2. Create the incident-responder task
text
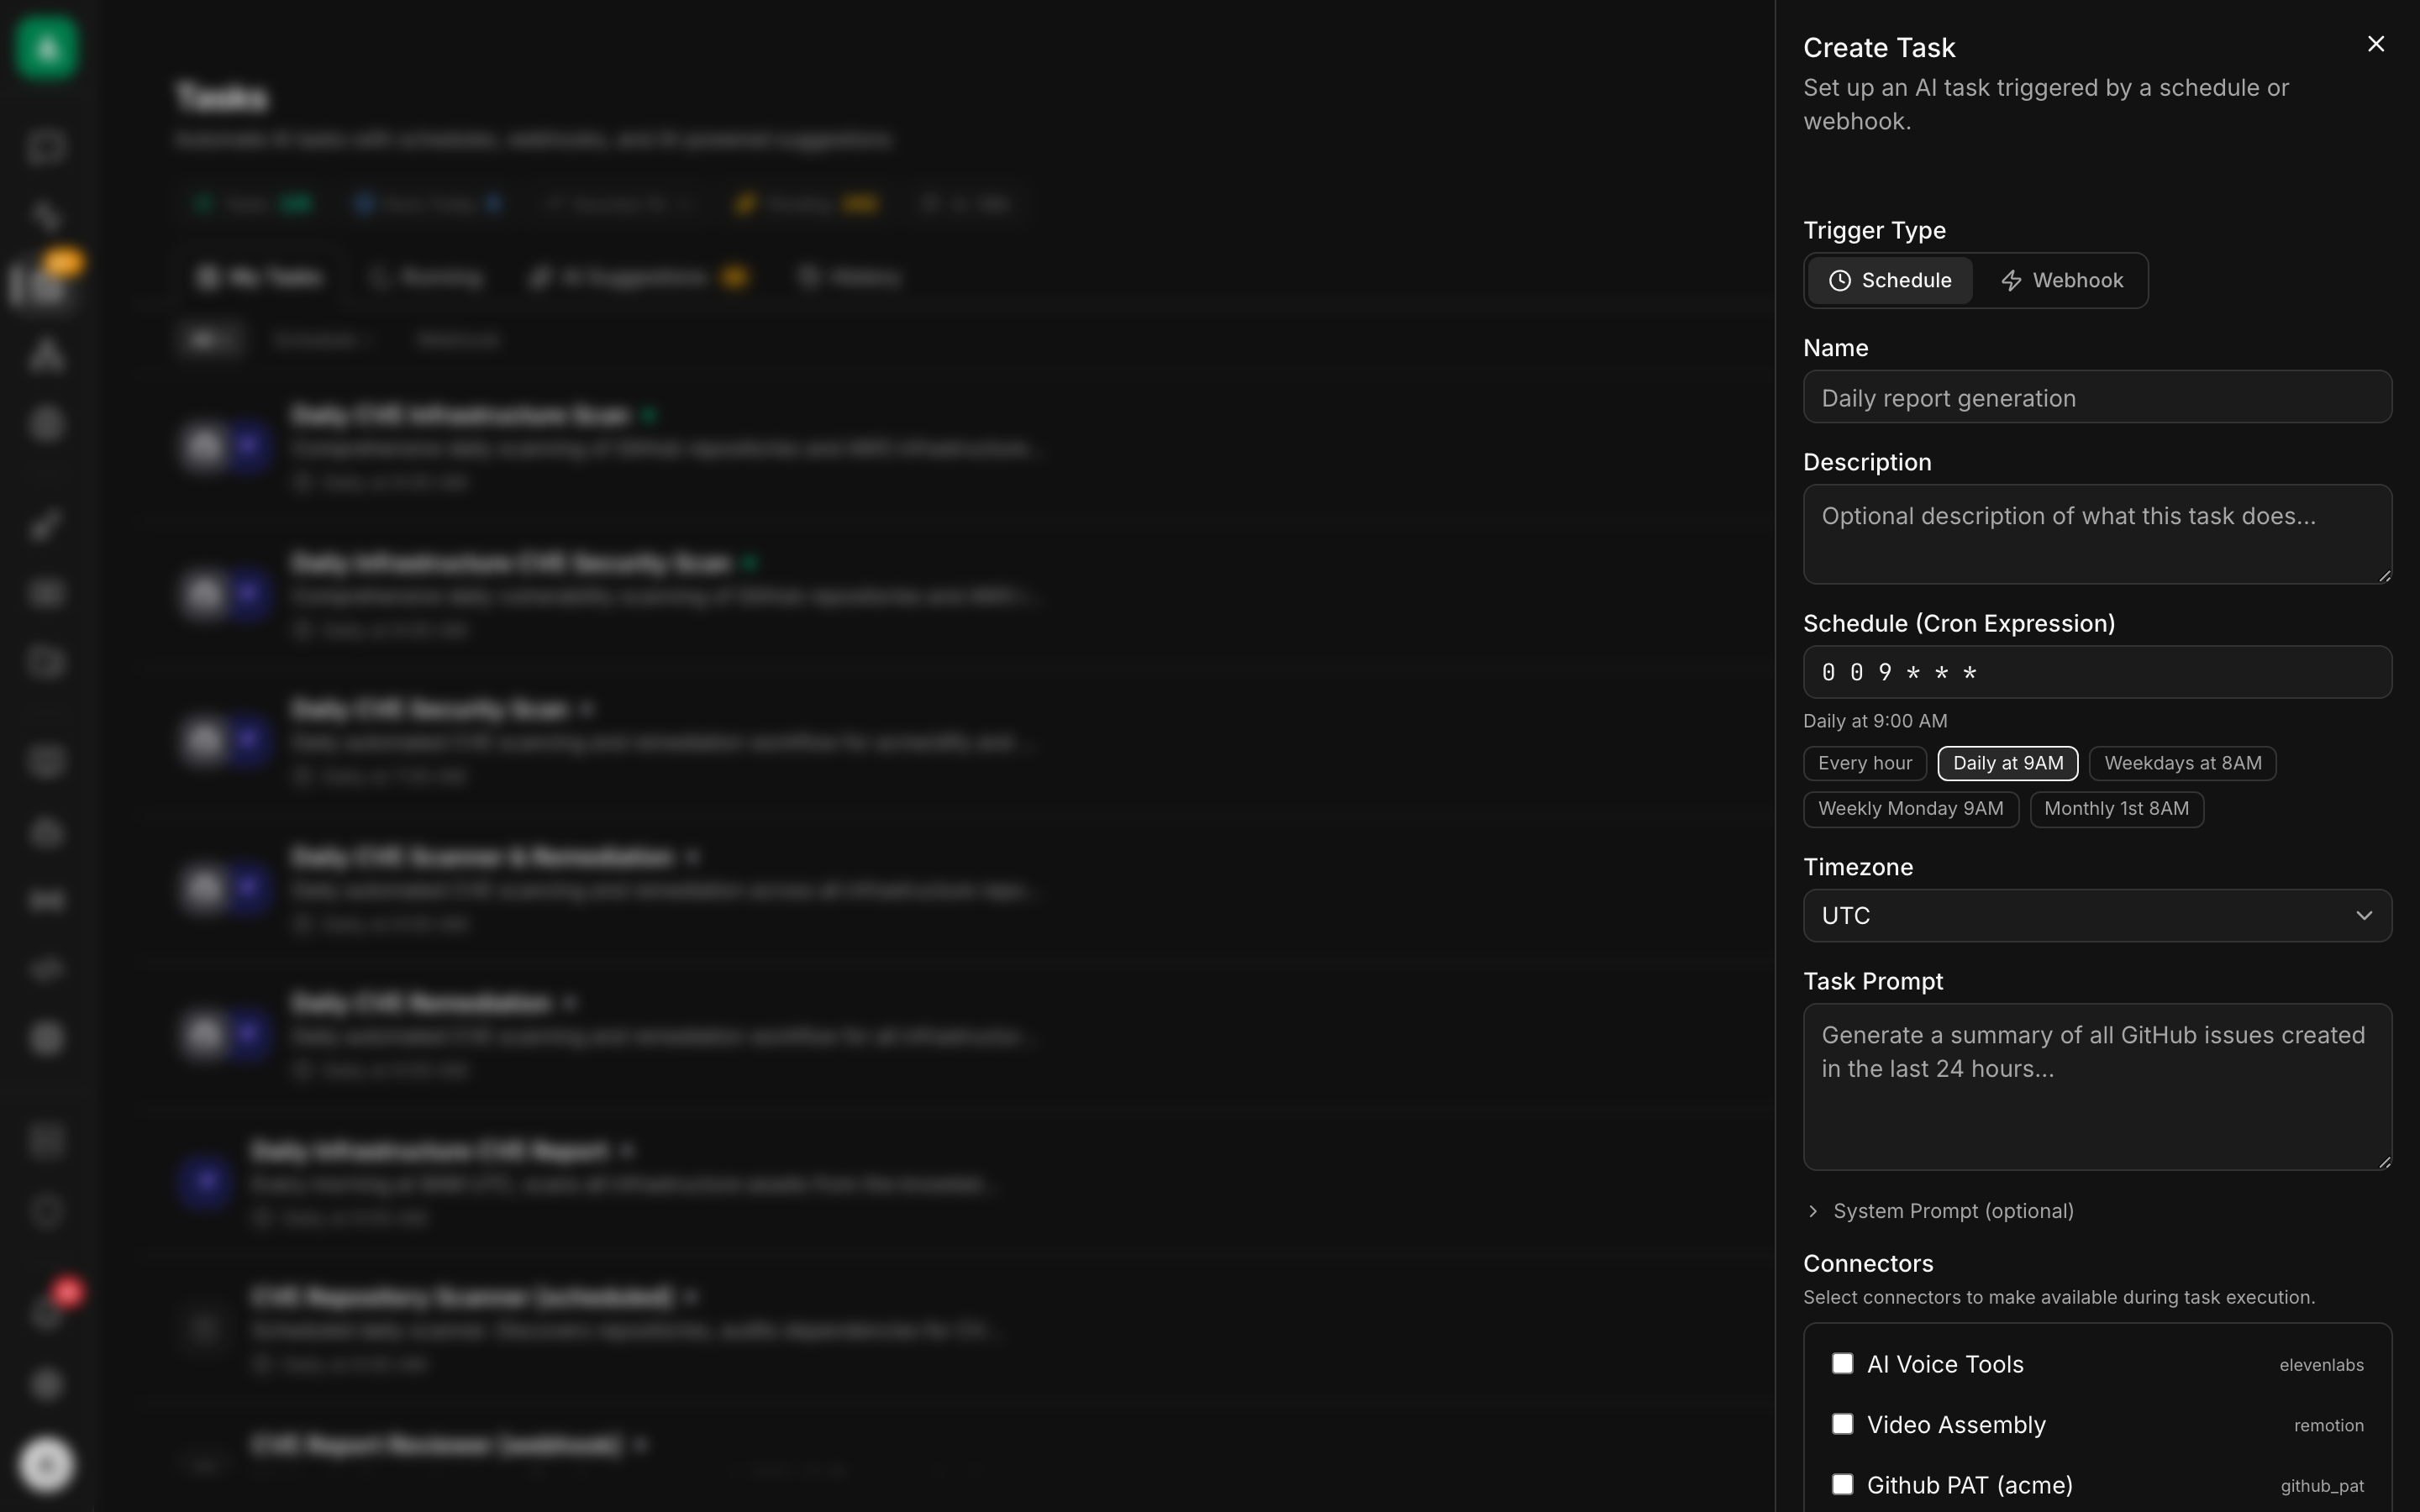
1. Open /tasks → click "+ New Task".
2. Trigger Type: Webhook.
3. Name: incident-responder. Realm: infrastructure.
4. Task Prompt: paste the instruction from the API tab.
5. Connectors: tick k8s-prod-us, aws-prod, github-services,
   grafana-prod, slack.
6. Approval defaults: write = policy.
7. Cost cap (USD/day): 50.00. Min interval (s): 30.
   Max concurrent runs: 10.
8. Save. Copy the Webhook URL and Secret.bash
curl -X POST http://localhost:8080/api/v1/tasks \
  -H "authorization: Bearer $TOKEN" -H 'content-type: application/json' \
  -d '{
    "name":"incident-responder",
    "agent":"default",
    "realm":"infrastructure",
    "trigger":{"kind":"webhook"},
    "input_template":{
      "instruction":"A Grafana alert arrived: {{trigger.body}}. Identify the affected service and environment from the alert labels. Diagnose: (a) check Kubernetes for pod state, recent events (CrashLoopBackOff, OOMKilled, Failed), and the last 5 minutes of ERROR logs for the service; (b) if the alert mentions a database/queue, check the corresponding AWS resource state via the aws connector; (c) check GitHub for any PRs to that service merged in the last 2 hours; (d) if a Grafana panel is referenced in the alert, render it and include it. Compose a one-paragraph hypothesis: what failed, what likely caused it, what to check next. Post to Slack #oncall as a new message (not a thread) with: severity emoji, service name, hypothesis, links back to alert + relevant resources. Be specific — vague pages are useless at 3 AM."
    },
    "approval_defaults":{"write":"policy"},
    "cost_cap_usd_per_day": 50.00,
    "min_interval_secs": 30,
    "max_concurrent_runs": 10
}'3. Set up the Grafana alert webhook
text
1. In Grafana: Alerting → Contact points → New.
2. Type: Webhook.
3. URL: paste the webhook URL from step 2.
4. HTTP Method: POST.
5. Custom headers: add X-Agentcy-Signature with a computed HMAC, OR
   trust your network path (Grafana on the same VPC) and disable HMAC
   on this Agentcy webhook. For prod, use the proxy approach (see notes).
6. Notification policy: route the alert rules you care about to this
contact point.text
Grafana doesn't compute HMAC natively. Two options:

  a) Trust the network: Grafana and Agentcy on the same private VPC.
     Set the Agentcy webhook trigger's verify_signature: false.
  b) Insert a tiny HMAC-signing proxy: a Cloudflare Worker, an Nginx
     + lua, or a small Lambda that computes the signature header
before forwarding to Agentcy.4. Add a policy so Slack pages don't need approval
text
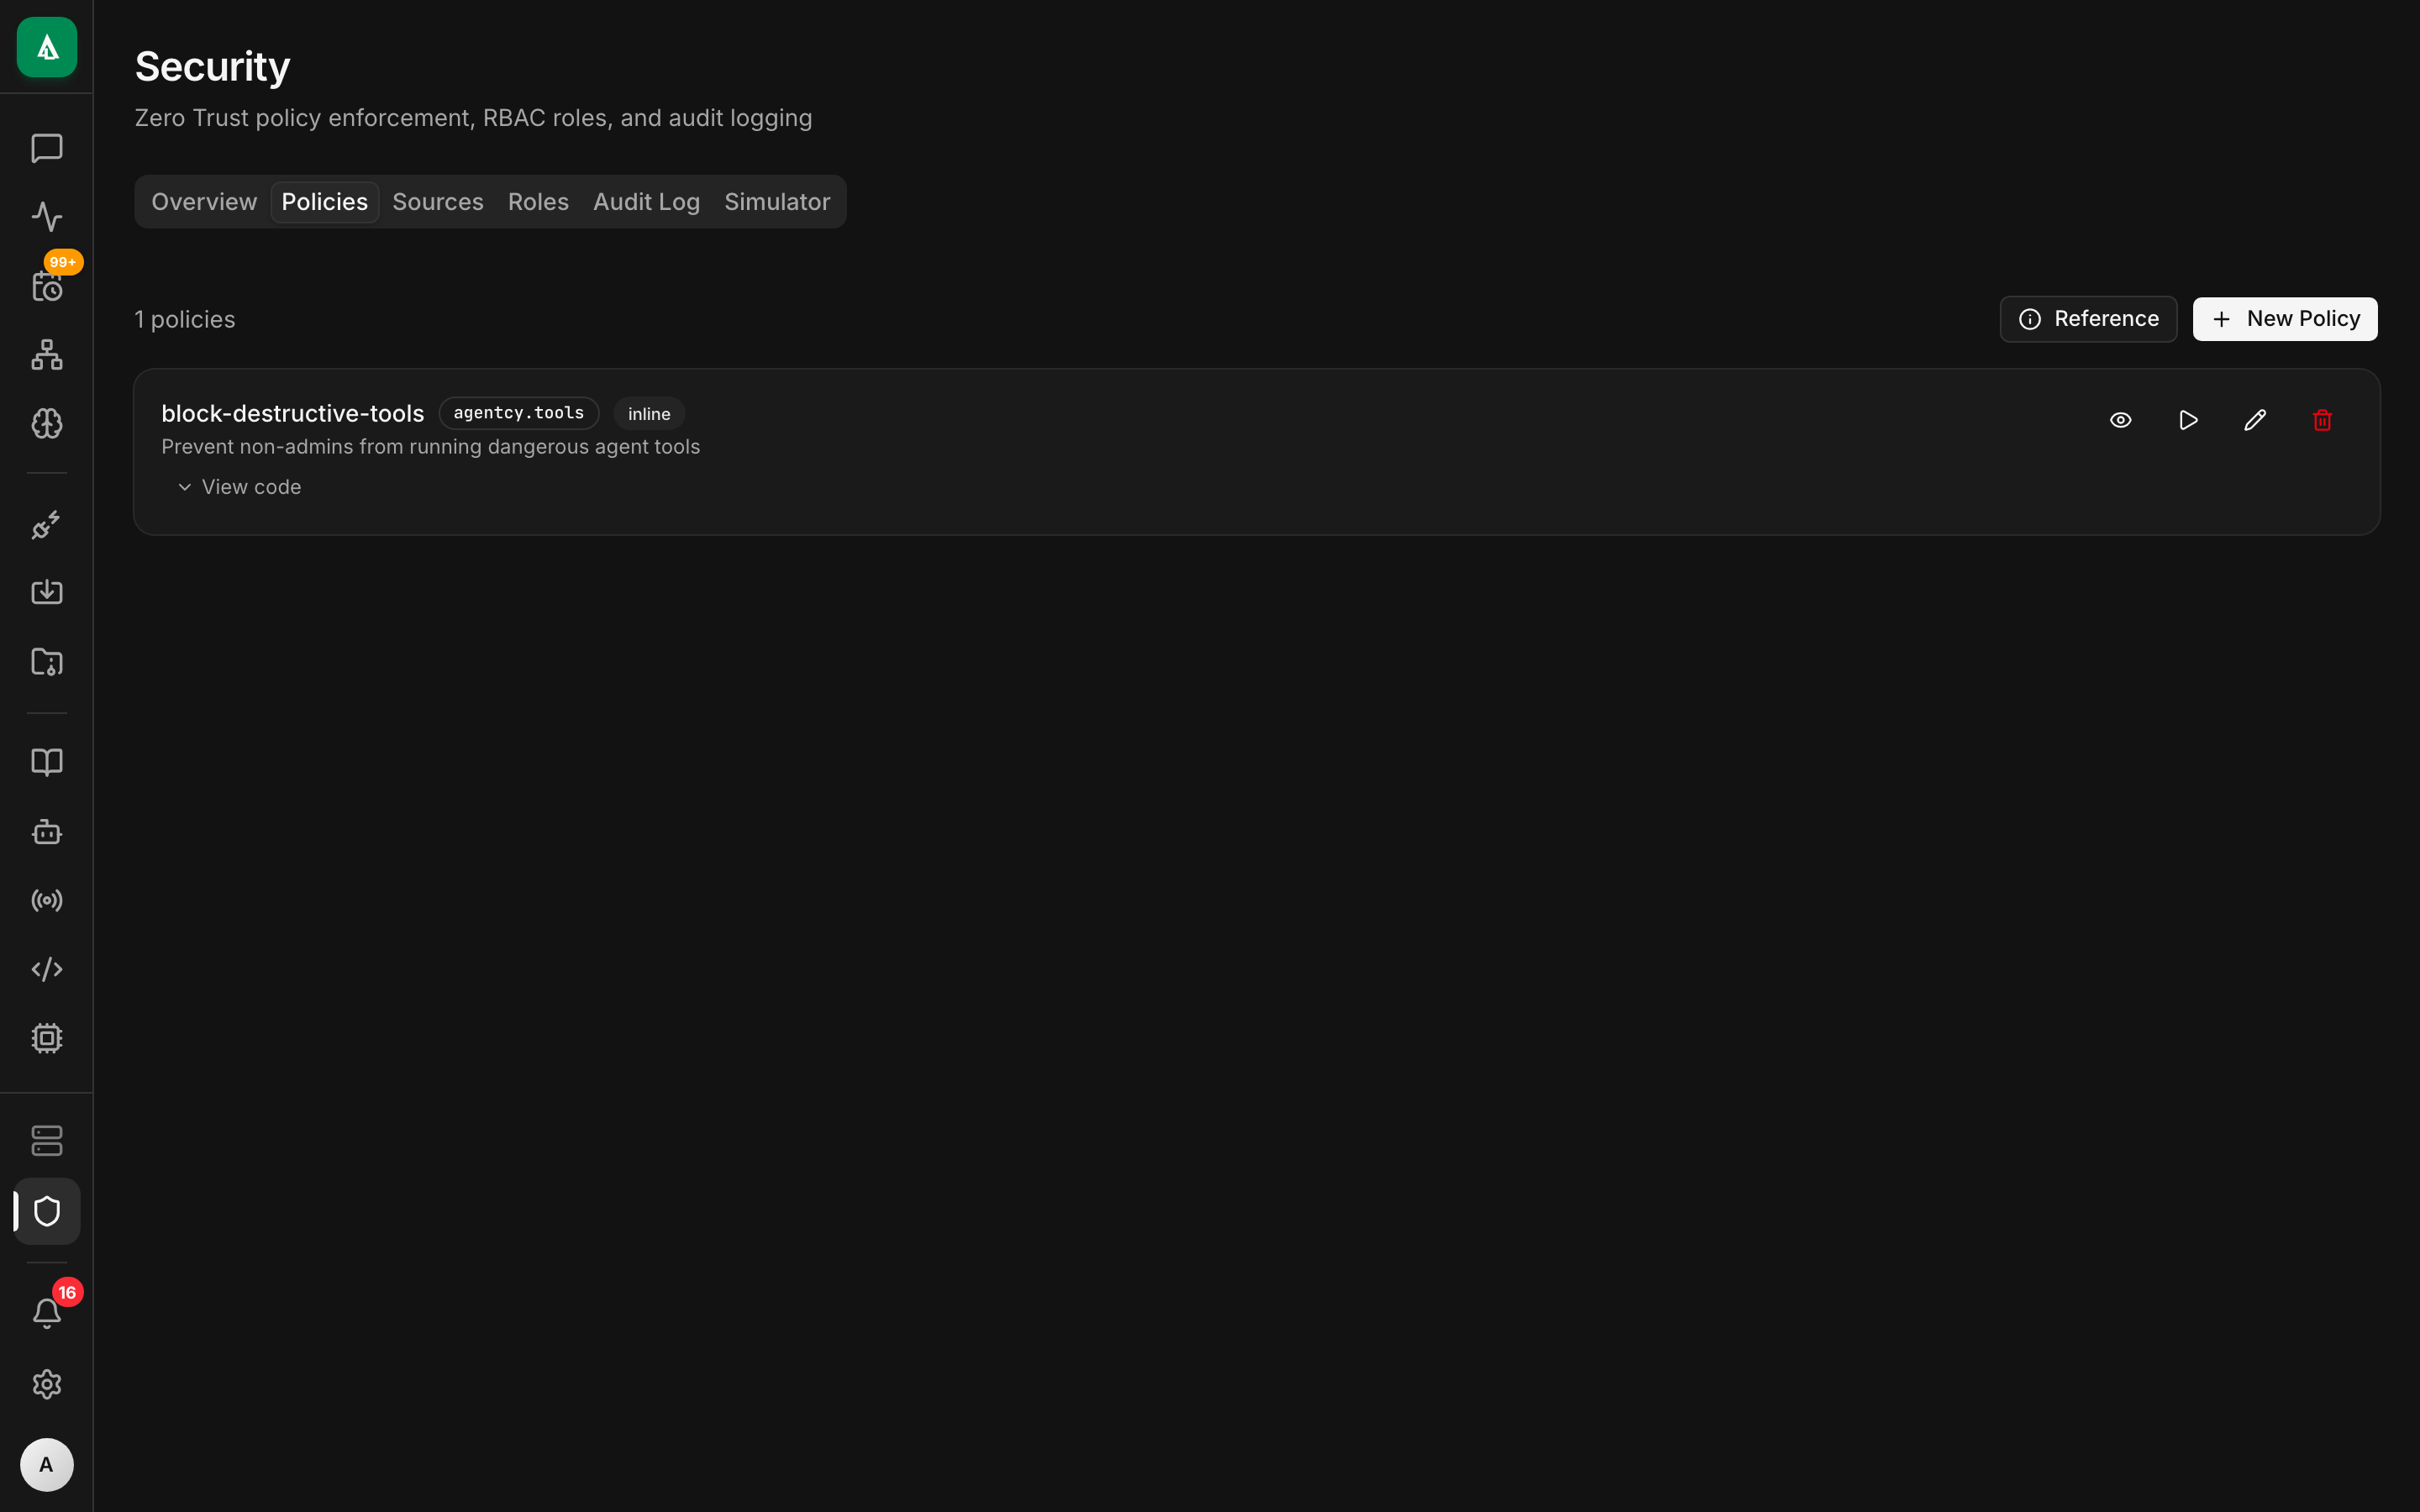
1. Open /security → Policies tab → "+ New Policy".
2. Name: sre-allow-oncall-pages. Package: agentcy.sre.
3. Paste the Rego from the API tab.
4. Click "Test" → paste a sample input → confirm allow.
5. Enable.rego
package agentcy.sre

allow {
  input.subject.task == "incident-responder"
  input.resource.connector == "slack"
  input.resource.tool == "slack.post_message"
  startswith(input.resource.args.channel, "#oncall")
}This scopes the auto-allow to only #oncall. Posting to #general would still need approval.
5. Test with a sample alert
text
1. In Grafana: contact-points → click "Test" on your webhook contact.
   This sends a synthetic firing alert.
2. In Agentcy: open /tasks → incident-responder → History tab.
3. Click the latest run → watch the transcript stream live in the
   right pane.
4. The Slack message lands in #oncall within ~10 s of completion.bash
# Built-in sample
curl -X POST http://localhost:8080/api/v1/webhook-samples/grafana-alert-firing/run \
  -H "authorization: Bearer $TOKEN" -H 'content-type: application/json' \
  -d '{"task_id":"task_..."}'

# Stream events
curl -N "http://localhost:8080/api/v1/tasks/$TASK_ID/runs/$RUN_ID/events" \
-H "authorization: Bearer $TOKEN"Worked example
Production task with all the production knobs:
json
{
  "name": "incident-responder",
  "agent": "default",
  "realm": "infrastructure",
  "trigger": { "kind": "webhook" },
  "input_template": {
    "instruction": "...the long instruction above...",
    "default_severity": "P2",
    "oncall_channel": "#oncall"
  },
  "approval_defaults": { "write": "policy" },
  "cost_cap_usd_per_day": 50.00,
  "min_interval_secs": 30,
  "max_concurrent_runs": 10,
  "escalation": [
    { "after_secs": 300, "notify": "slack:#oncall-lead" }
  ]
}min_interval_secs: 30— protects against alert storms.escalation— if the diagnosis doesn't post within 5 minutes, notify a lead.
A complementary policy that audits everything destructive:
rego
package agentcy.sre

audit[msg] {
  input.subject.task == "incident-responder"
  input.resource.connector == "kubernetes"
  input.resource.tool_effect != "read"
  msg := sprintf("incident-responder issued K8s write: %v", [input.resource.tool])
}What good looks like
A diagnosis post in Slack #oncall looks like this:

The audit + run transcript shows: kubernetes.list_pods, kubernetes.events_for_pod, kubernetes.logs_for_service, github.get_commit, github.diff, aws.describe_rds_instance, grafana_render_panel, slack.post_message.
Variations
- Multi-cluster. One source per cluster, named by region. The agent picks the right one from the alert's labels (
cluster=prod-us). - Page only on P1. In the instruction, "if
alert_labels.severityis not P0 or P1, only post to#oncall-low, not#oncall.". Adjust the policy to match. - Auto-rollback proposals. Add to the instruction: "if you identify a likely-bad recent deploy, also include the exact
kubectl rollout undo deployment/<name>command oncall can run." Don't auto-execute it without an explicit approval gate. - Graph context. If you've ingested service ownership into the graph (a
Service → :OWNED_BY → :Teamedge), have the agent tag the responsible team's Slack handle. - Context-aware re-summary. Add a 5-min cron task that re-summarizes ongoing alerts in
#oncall— useful during long incidents when the channel scrolls past the original page.
Troubleshooting
The webhook fires but the task does nothing. Most often: HMAC mismatch. Either add HMAC at a proxy or, for trusted networks, set the webhook trigger to verify_signature: false.
The diagnosis is generic ("something is wrong with payment-service"). Either the alert payload is sparse (Grafana's "Default message" is famously unstructured — switch to a custom JSON template that includes labels + values), or the agent isn't getting useful K8s data. Check the run transcript for tool errors; usually the K8s source can't see the right namespace.
Slack page doesn't show up. The bot isn't in #oncall. Invite it (/invite @agentcy-bot) or grant chat:write.public.
Grafana panel render fails with renderer_unavailable. The renderer plugin or sidecar isn't reachable. See Grafana renderer prerequisite. The diagnosis still posts — just without the embedded chart.
Alert storms blow through the cost cap.min_interval_secs is your friend. Set it to 60 or 120 for storm protection. Also: tighten Grafana's "for" duration so flapping alerts don't fire the contact point repeatedly.
The K8s connector returns "forbidden" on log reads. Service account RBAC is too narrow. Minimum is pods/log: get and events: list in the service's namespace.
Next
- Concept: Channels & Triggers — full trigger model.
- How-To: Writing Rego Policies — patterns for audit + allow.
- How-To: Tasks — escalation and cost caps.
- Grafana connector — including the bundled local stack.
- Use Case: CI/CD Intelligence — pair with this so the same channel sees deploys + incidents.